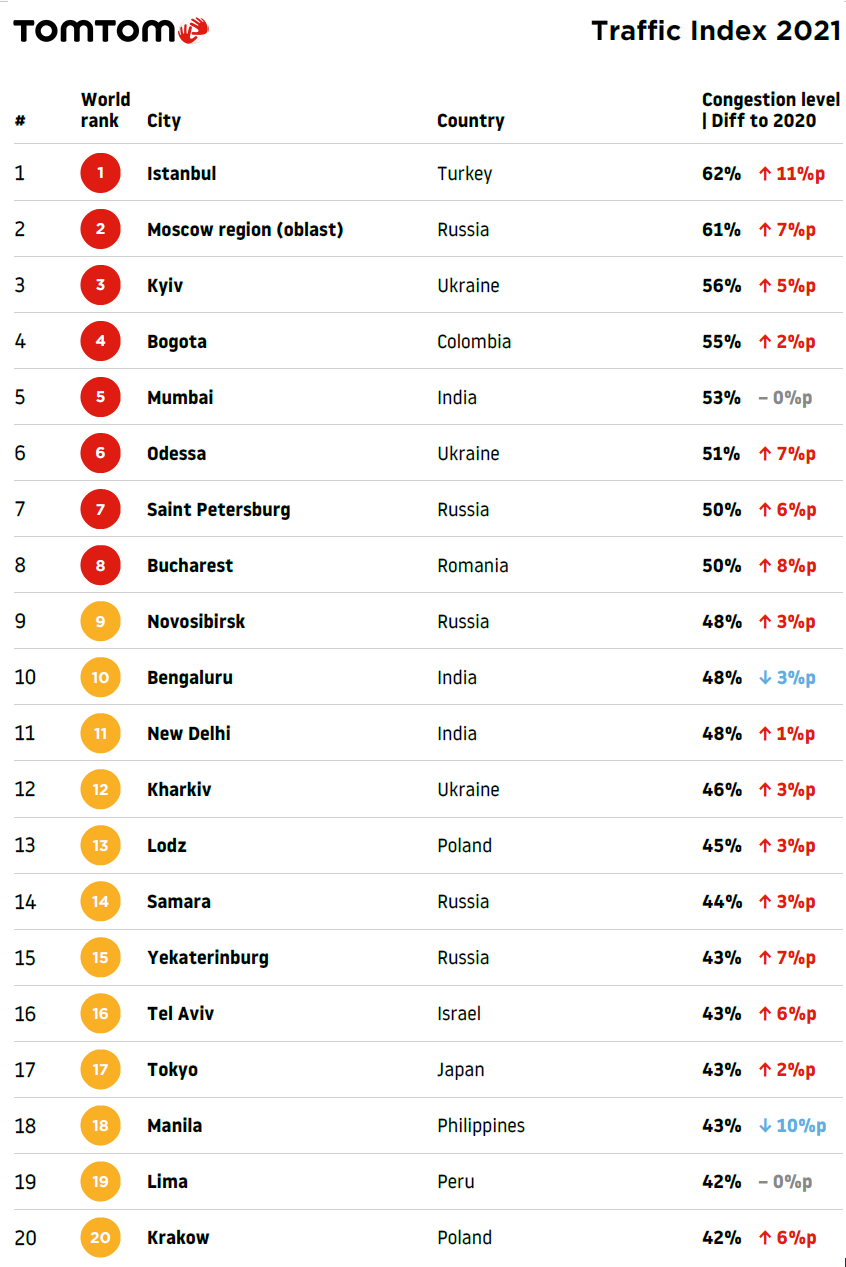
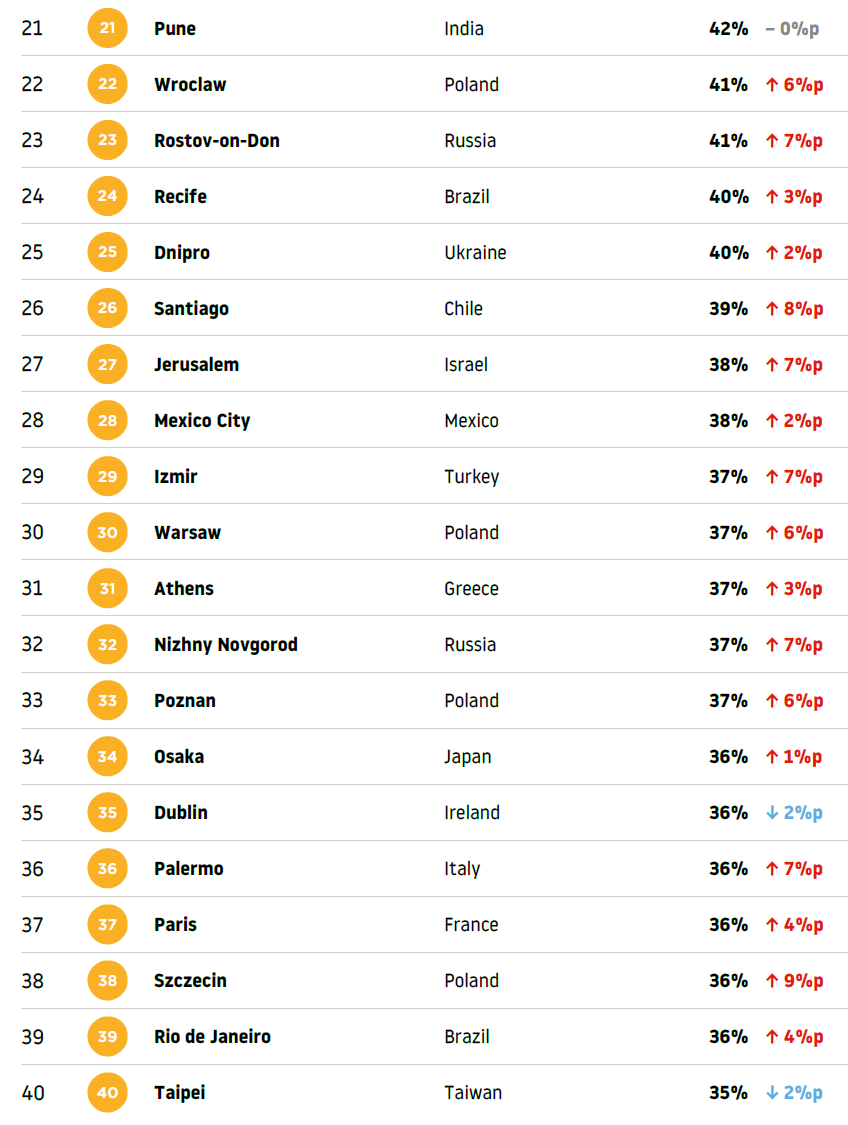
Covering 404 cities across 58 countries on 6 continents, our Traffic Index ranks urban congestion worldwide and provides free access to city-by-city information. You, along with drivers, city planners, automakers and policy makers, can use the index to help tackle traffic-related challenges.
Traffic congestion worsened last year in most of the 436 cities rated by Dutch navigation company TomTom.
If you had to drive somewhere in Bengaluru, India, last year, your best bet would have been to make your move on April 6. That Saturday, the average drive in the city formerly known as Bangalore took 30 percent longer than it would have had the roads been empty. No easy trip, sure, but far quicker than most: Over the course of 2019, on average, congestion increased drive times by 71 percent. During evening rush hours, anyone driving what should have been a 30-minute trip spent more than an hour and five minutes behind the wheel.
Those figures give the megacity the unwelcome distinction of hosting the world’s worst traffic, according to the 2019 edition of TomTom’s Traffic Index. Rounding out the “top” five are Manila, Bogotá, Mumbai, and Pune. The report, which the Dutch navigation and mapping company released Tuesday, ranks cities by the average time added to a trip. It also includes details on when congestion is heaviest and lightest, how highways compare with surface streets, and how much time drivers wasted waiting for other drivers to get out of their way. (As the adage says: You’re not in traffic, you are traffic.)
So you can see that the best time to drive in Paris is in mid-August, when the whole country goes on vacation. And that the evening rush hour in Cairo adds nearly twice as much time to the average trip as the morning commute. And that while Angelenos have the right to gripe about America’s worst traffic, the city’s 42 percent congestion level looks peachy compared to the megacities of India and southeast Asia. (Trailing Los Angeles in the US top five are New York, San Francisco, San Jose, and Seattle.)
It’s easy to see why cities in India, Southeast Asia, and South America dominate the top of this list. “It’s partly a matter of a huge economic success,” says Nick Cohn, who runs TomTom’s traffic data business. “But also a complete inadequacy of alternatives for the public to get around.” Bengaluru, for example, has seen its population roughly double since 2001. The roads, traffic management, and transit systems that are needed to move all those new residents with some measure of efficiency just aren’t there.
TomTom pulls its data from the more than 600 million drivers who use its maps, whether on an old school aftermarket navigation device, via their car’s built-in navigation system, or a smartphone app. Users don’t have to see the TomTom logo to be part of its data: The company provides data for Apple Maps, and recently struck a deal to do the same for Huawei.
TomTom’s list of the world’s 10 most congested cities. (TOMTOM)
The traffic report is available for free, but cities that want the kind of data deep dive necessary for actually easing congestion will have to pay up. TomTom offers real-time traffic data, an “event reporter” that logs things like road closures, historical data dating to 2008, analyses of which routes drivers prefer over others, and more.
On the off chance that confirming your city is horribly congested isn’t bad enough, the report also tracks traffic from one year to the next—and the numbers aren’t encouraging. From 2018 to 2019, traffic worsened in a majority of the 436 ranked cities; few saw improvements. In the US, at least, some of that can be blamed on the strong economy. More people working means more people driving. It also means more congestion in 44 of the 80 US cities listed. Just five—Columbus, Detroit, Louisville, Milwaukee, and Cleveland—showed drops, all of them modest.
When it comes to bringing those gains to more cities, TomTom’s Cohn urges city planners against trying to make driving easier. “I really don’t believe that it’s possible, at least on the road side, to build our way out of congestion,” he says. He advises better traffic management: things like better synchronized traffic lights, but also more buses, better cycling infrastructure, and smarter tools to guide people away from cars. Helsinki, for example, lets people plan and pay for multimodal journeys in a single app, so they don’t have to cobble together disparate information on transit schedules, bike share locations, and so on. “You don’t have to add capacity,” Cohn says. “You just have to use what you have in a smarter way.”
TomTom Traffic Index
Ranking 2021
https://www.tomtom.com/traffic-index/ranking/
Covering 404 cities across 58 countries on 6 continents, our Traffic Index ranks urban congestion worldwide and provides free access to city-by-city information. You, along with drivers, city planners, automakers and policy makers, can use the index to help tackle traffic-related challenges.
The world’s most traffic-choked cities, ranked
Cities in Asia and South America dominate the “top” of the list. Los Angeles, the US’s worst, finishes 31st.
wired.com
(2019)
https://wired.me/science/transportation/worlds-most-traffic-choked-cities-ranked/
Traffic congestion worsened last year in most of the 436 cities rated by Dutch navigation company TomTom.
If you had to drive somewhere in Bengaluru, India, last year, your best bet would have been to make your move on April 6. That Saturday, the average drive in the city formerly known as Bangalore took 30 percent longer than it would have had the roads been empty. No easy trip, sure, but far quicker than most: Over the course of 2019, on average, congestion increased drive times by 71 percent. During evening rush hours, anyone driving what should have been a 30-minute trip spent more than an hour and five minutes behind the wheel.
Those figures give the megacity the unwelcome distinction of hosting the world’s worst traffic, according to the 2019 edition of TomTom’s Traffic Index. Rounding out the “top” five are Manila, Bogotá, Mumbai, and Pune. The report, which the Dutch navigation and mapping company released Tuesday, ranks cities by the average time added to a trip. It also includes details on when congestion is heaviest and lightest, how highways compare with surface streets, and how much time drivers wasted waiting for other drivers to get out of their way. (As the adage says: You’re not in traffic, you are traffic.)
So you can see that the best time to drive in Paris is in mid-August, when the whole country goes on vacation. And that the evening rush hour in Cairo adds nearly twice as much time to the average trip as the morning commute. And that while Angelenos have the right to gripe about America’s worst traffic, the city’s 42 percent congestion level looks peachy compared to the megacities of India and southeast Asia. (Trailing Los Angeles in the US top five are New York, San Francisco, San Jose, and Seattle.)
It’s easy to see why cities in India, Southeast Asia, and South America dominate the top of this list. “It’s partly a matter of a huge economic success,” says Nick Cohn, who runs TomTom’s traffic data business. “But also a complete inadequacy of alternatives for the public to get around.” Bengaluru, for example, has seen its population roughly double since 2001. The roads, traffic management, and transit systems that are needed to move all those new residents with some measure of efficiency just aren’t there.
TomTom pulls its data from the more than 600 million drivers who use its maps, whether on an old school aftermarket navigation device, via their car’s built-in navigation system, or a smartphone app. Users don’t have to see the TomTom logo to be part of its data: The company provides data for Apple Maps, and recently struck a deal to do the same for Huawei.
TomTom’s list of the world’s 10 most congested cities. (TOMTOM)
The traffic report is available for free, but cities that want the kind of data deep dive necessary for actually easing congestion will have to pay up. TomTom offers real-time traffic data, an “event reporter” that logs things like road closures, historical data dating to 2008, analyses of which routes drivers prefer over others, and more.
On the off chance that confirming your city is horribly congested isn’t bad enough, the report also tracks traffic from one year to the next—and the numbers aren’t encouraging. From 2018 to 2019, traffic worsened in a majority of the 436 ranked cities; few saw improvements. In the US, at least, some of that can be blamed on the strong economy. More people working means more people driving. It also means more congestion in 44 of the 80 US cities listed. Just five—Columbus, Detroit, Louisville, Milwaukee, and Cleveland—showed drops, all of them modest.
When it comes to bringing those gains to more cities, TomTom’s Cohn urges city planners against trying to make driving easier. “I really don’t believe that it’s possible, at least on the road side, to build our way out of congestion,” he says. He advises better traffic management: things like better synchronized traffic lights, but also more buses, better cycling infrastructure, and smarter tools to guide people away from cars. Helsinki, for example, lets people plan and pay for multimodal journeys in a single app, so they don’t have to cobble together disparate information on transit schedules, bike share locations, and so on. “You don’t have to add capacity,” Cohn says. “You just have to use what you have in a smarter way.”
「世界で最も渋滞がひどい都市」のランキングから、交通インフラの進むべき道が見えてきた
Wired Japan
(2019)
https://wired.jp/2020/03/05/worlds-most-traffic-choked-cities-ranked/
カーナビ技術を開発するオランダのトムトムが2019年に世界436都市を評価したところ、そのほとんどで交通渋滞は悪化していた。
オランダのトムトムが、このほど「世界で最も交通渋滞がひどい都市」のランキングを発表した。インドと東南アジア、南米の都市が上位を独占しているが、背景には経済成長に対するインフラ整備の遅れが挙げられる。ところが、道路の整備だけでは問題は解決しないのだという。いったいどういうことなのか。
もしインドのベンガルール(旧称バンガロール)市内を2019年にクルマで走る必要があったとしたら、なかでもましな日は4月6日だったに違いない。その土曜に市内をクルマで移動するために必要だった平均所要時間は、道路がガラガラだった場合の30パーセント増で済んだからだ。決して楽なドライヴではないが、ほかの日に比べれば相当にましなほうだった。
なにしろ昨年1年のベンガルール市内の交通渋滞は、クルマの走行時間を平均で71パーセントも増加させていた。夜のラッシュアワー時にいたっては、30分の道のりに1時間5分以上もの時間をかけなければならなかったという。
カーナビやデジタルマッピングの技術を開発するオランダのトムトムが20年1月29日付で発表した2019年版「TomTom Traffic Index」によると、ベンガルールは「世界で最も交通渋滞がひどい都市」というありがたくない称号に輝いた。ベンガルールに続いて「トップ5」にランクインした都市は、フィリピンのマニラ、コロンビアのボゴタ、そしてインドのムンバイとプネーである。
TomTom Traffic Indexは、1回のドライヴに追加される平均時間に基づいて各都市をランクづけしている。このレポートには、最も混雑する時間帯と混雑しない時間帯、高速道路と一般道の比較、ほかのクルマが道を空けるまで待つドライヴァーがどれだけの時間を無駄にしたのかなどについても、詳しく説明されている(格言でも言われている通り、「あなたが渋滞に巻き込まれているのではなく、あなた自身が渋滞なのだ」)。
インドと東南アジア、南米の都市が上位を独占
このレポートを見ると、パリ市内をクルマで走るうえでいちばんいい時期は、フランス中の人々がヴァカンスに出かける8月中旬であることがわかる。またエジプトのカイロでは、夜のラッシュアワーには朝の通勤時の倍近くの時間がかかるという。ロサンジェルスは米国内で最も道路が混雑する都市だが、42パーセントという渋滞レヴェルはインドや東南アジアの大都市に比べるとずっとましである(ロザンジェルスに続く米国内のトップ5は、ニューヨークとサンフランシスコ、サンノゼ、シアトルだった)。
インドと東南アジア、南米の各都市がTomTom Traffic Indexの上位を独占しているが、その理由は想像に難くない。「要因のひとつは、経済の著しい発展です」と、トムトムの交通データ事業を統括するニック・コーンは語る。「その一方で、市民が渋滞を回避するための代替策が決定的に不足しているという事情もあります」
例えばベンガルールの場合、同市の人口は01年から現在までの間にほぼ倍増している。ところが、新規の住民を効率よく運ぶために必要な道路や交通管理、輸送システムといったものがまるで整備されていないのだ。
トムトムは、カーナビやスマートフォンアプリなどで同社のマップを利用しているドライヴァー6億人からデータを入手している。ユーザーがデータを提供する際に「TomTom」のロゴを目にすることはない。同社はアップルの地図アプリ「マップ」にデータを提供しており、ファーウェイともデータ提供の契約を結んだばかりだ。
TomTom Traffic Indexは誰でも無料で閲覧できる。ただし、交通渋滞の緩和に必要なデータを掘り下げたい都市などの場合は、料金の支払いが必要になる。またトムトムは、ウェブアプリ「Road Event Reporter」で、交通データをリアルタイムで提供している。このアプリでは、道路の閉鎖情報や08年以降の過去データ、ドライヴァーが好むルートの分析などを提供している。
これらの都市の交通渋滞がひどいことを明らかにするだけでは足りないと言わんばかりに、TomTom Traffic Indexは毎年の交通量の推移も追跡している。そして、この数字は希望がもてるものではない。
というのも、ランクインしている世界436都市のほとんどで、18年から19年にかけて状況は悪化していた。改善が見られた都市はごく一部にすぎない。米国の場合、少なくともその一因は強い経済にあると考えられる。働く人が増えれば、クルマを運転する人も増える。そうなれば、おのずと渋滞も増える。
米国でランクインしている80都市のうち、44都市で渋滞が増えていた。減ったのはコロンバスとデトロイト、ルイヴィル、ミルウォーキー、クリーヴランドの5都市だけで、低下率はいずれもわずかなものだった。
道路のキャパシティーを増やす必要はない
この調査結果をより多くの都市が生かすには、どうすればいいのだろうか。トムトムのコーンは都市計画家たちに対し、クルマの運転を楽にする努力はやめようと呼びかけている。「道路を建設したところで交通渋滞が解消されるとは思えません」と、彼は言う。そうするのではなく、交通管理体制を改善すべきだとコーンは助言している。
つまり、信号機をうまく同期させる、バスを増やす、サイクリングのインフラを整える、市民をクルマから遠ざけるためのツールの機能を高める、といったことに力を注ぐのだ。例えば、フィンランドのヘルシンキに住む市民は、ひとつのアプリで多様な移動の計画を立て、その料金を支払うことができる。乗り継ぎのスケジュールやバイクシェアの場所といった異なる情報を、わざわざつなぎ合わせなくてもいいのだ。
「キャパシティーを増やす必要はありません」と、コーンは言う。「いまあるものを、もっとスマートに活用すればいいのです」