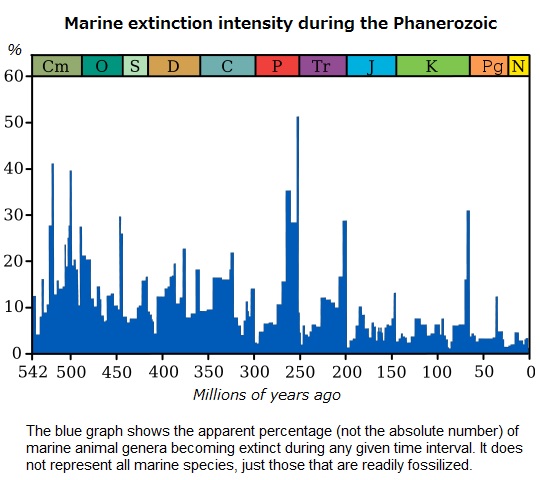
This figure shows the genus extinction intensity, i.e. the fraction of genera that are present in each interval of time but do not exist in the following interval. The data itself is taken from Rohde & Muller (2005, Supplementary Material), and are based on the Sepkoski’s Compendium of Marine Fossil Animal Genera (2002). Note that these data do not represent all genera that have ever lived, but rather only a selection of marine genera whose qualities are such that they are easily preserved as fossils.
In the original version of this chart, the “Big Five” mass extinctions (Raup & Sepkoski 1982) are labeled in large font, and a variety of other features are labeled in smaller font. The two extinction events occurring in the Cambrian (i.e. Dresbachian and Botomian) are very large in percentage magnitude, but are not well known because of the relative scarcity of fossil producing life at that time (i.e. they are small in absolute numbers of known taxa). The Middle Permian extinction is now argued by many to constitute a distinct extinction horizon, though the actual extinction amounts are sometimes lumped together with the End Permian extinctions in reporting. As indicated, the “Late Devonian” extinction is actually resolvable into at least three distinct events spread over a period of ~40 million years. As these data are derived at the genus level, one can anticipate that the number of species extinctions is a higher percentage than shown here.
Many of the extinction events appear to be somewhat extended in time. In at least some cases this is the result of a paleontological artifact known as the Signor-Lipps effect (Signor & Lipps 1982). Briefly, this is the observation that inadequate sampling can cause a taxon to seem to disappear before its actual time of extinction. This has the effect of making an extinction event appear extended even if it occurred quite rapidly. Hence, when estimating the true magnitude of an extinction event it would be common to combine together the events occurring over several preceding bins as long as they also show excess extinctions. This explains why many estimates of the magnitude of an extinction event may be larger than the 20-30% shown as the largest single bin for most of the extinctions shown here.
An extinction event (also known as a mass extinction or biotic crisis) is a widespread and rapid decrease in the amount of life on Earth. Such an event is identified by a sharp change in the diversity and abundance of macroscopic life. It occurs when the rate of extinction increases with respect to the rate of speciation. Because the majority of diversity and biomass on Earth is microbial, and thus difficult to measure, recorded extinction events affect the easily observed, biologically complex component of the biosphere rather than the total diversity and abundance of life.
The age of the Earth is about 4.54 billion years. The earliest undisputed evidence of life on Earth dates at least from 3.5 billion years ago, during the Eoarchean Era after a geological crust started to solidify following the earlier molten Hadean Eon. There are microbial mat fossils found in 3.48 billion-year-old sandstone discovered in Western Australia. Other early physical evidence of a biogenic substance is graphite in 3.7 billion-year-old metasedimentary rocks discovered in Western Greenland. More than 99 percent of all species, amounting to over five billion species, that ever lived on Earth are estimated to be extinct. Estimates on the number of Earth’s current species range from 10 million to 14 million, of which about 1.2 million have been documented and over 86 percent have not yet been described.
Extinction occurs at an uneven rate. Based on the fossil record, the background rate of extinctions on Earth is about two to five taxonomic families of marine invertebrates and vertebrates every million years. Marine fossils are mostly used to measure extinction rates because of their superior fossil record and stratigraphic range compared to land organisms.
Since life began on Earth, five major mass extinctions have significantly exceeded the background extinction rate. The most recent, the Cretaceous–Paleogene extinction event, which occurred approximately 66 million years ago (Ma), was a large-scale mass extinction of animal and plant species in a geologically short period of time. In addition to the five major mass extinctions, there are numerous minor ones as well and the ongoing mass-extinction caused by human activity is sometimes called the sixth extinction. Mass extinctions seem to be a Phanerozoic phenomenon, with extinction rates low before large complex organisms arose.
Estimates of the number of major mass extinctions in the last 540 million years range from as few as five to more than twenty. These differences stem from the threshold chosen for describing an extinction event as “major”, and the data chosen to measure past diversity.
File:Extinction intensity.svg
https://en.wikipedia.org/wiki/File:Extinction_intensity.svg
This figure shows the genus extinction intensity, i.e. the fraction of genera that are present in each interval of time but do not exist in the following interval. The data itself is taken from Rohde & Muller (2005, Supplementary Material), and are based on the Sepkoski’s Compendium of Marine Fossil Animal Genera (2002). Note that these data do not represent all genera that have ever lived, but rather only a selection of marine genera whose qualities are such that they are easily preserved as fossils.
In the original version of this chart, the “Big Five” mass extinctions (Raup & Sepkoski 1982) are labeled in large font, and a variety of other features are labeled in smaller font. The two extinction events occurring in the Cambrian (i.e. Dresbachian and Botomian) are very large in percentage magnitude, but are not well known because of the relative scarcity of fossil producing life at that time (i.e. they are small in absolute numbers of known taxa). The Middle Permian extinction is now argued by many to constitute a distinct extinction horizon, though the actual extinction amounts are sometimes lumped together with the End Permian extinctions in reporting. As indicated, the “Late Devonian” extinction is actually resolvable into at least three distinct events spread over a period of ~40 million years. As these data are derived at the genus level, one can anticipate that the number of species extinctions is a higher percentage than shown here.
Many of the extinction events appear to be somewhat extended in time. In at least some cases this is the result of a paleontological artifact known as the Signor-Lipps effect (Signor & Lipps 1982). Briefly, this is the observation that inadequate sampling can cause a taxon to seem to disappear before its actual time of extinction. This has the effect of making an extinction event appear extended even if it occurred quite rapidly. Hence, when estimating the true magnitude of an extinction event it would be common to combine together the events occurring over several preceding bins as long as they also show excess extinctions. This explains why many estimates of the magnitude of an extinction event may be larger than the 20-30% shown as the largest single bin for most of the extinctions shown here.
Extinction event
Wikipedia
https://en.wikipedia.org/wiki/Extinction_event
An extinction event (also known as a mass extinction or biotic crisis) is a widespread and rapid decrease in the amount of life on Earth. Such an event is identified by a sharp change in the diversity and abundance of macroscopic life. It occurs when the rate of extinction increases with respect to the rate of speciation. Because the majority of diversity and biomass on Earth is microbial, and thus difficult to measure, recorded extinction events affect the easily observed, biologically complex component of the biosphere rather than the total diversity and abundance of life.
The age of the Earth is about 4.54 billion years. The earliest undisputed evidence of life on Earth dates at least from 3.5 billion years ago, during the Eoarchean Era after a geological crust started to solidify following the earlier molten Hadean Eon. There are microbial mat fossils found in 3.48 billion-year-old sandstone discovered in Western Australia. Other early physical evidence of a biogenic substance is graphite in 3.7 billion-year-old metasedimentary rocks discovered in Western Greenland. More than 99 percent of all species, amounting to over five billion species, that ever lived on Earth are estimated to be extinct. Estimates on the number of Earth’s current species range from 10 million to 14 million, of which about 1.2 million have been documented and over 86 percent have not yet been described.
Extinction occurs at an uneven rate. Based on the fossil record, the background rate of extinctions on Earth is about two to five taxonomic families of marine invertebrates and vertebrates every million years. Marine fossils are mostly used to measure extinction rates because of their superior fossil record and stratigraphic range compared to land organisms.
Since life began on Earth, five major mass extinctions have significantly exceeded the background extinction rate. The most recent, the Cretaceous–Paleogene extinction event, which occurred approximately 66 million years ago (Ma), was a large-scale mass extinction of animal and plant species in a geologically short period of time. In addition to the five major mass extinctions, there are numerous minor ones as well and the ongoing mass-extinction caused by human activity is sometimes called the sixth extinction. Mass extinctions seem to be a Phanerozoic phenomenon, with extinction rates low before large complex organisms arose.
Estimates of the number of major mass extinctions in the last 540 million years range from as few as five to more than twenty. These differences stem from the threshold chosen for describing an extinction event as “major”, and the data chosen to measure past diversity.