 The horizontal (x) axis is the yield in kilotons (on a logarithmic scale), the vertical (y) axis is the weight in kilograms (also on a log scale). The diagonal lines indicate specific yield-to-weight ratio regions.
Little Boy (Mk-1), Fat Man (Mk-3), and the postwar Fat Man improvements (Mk-4 — same weight, bigger yield) at the upper left, between 0.01 kt/kg and 0.001 kt/kg.
Kilotons per kilogram
by Alex Wellerstein
http://blog.nuclearsecrecy.com/2013/12/23/kilotons-per-kilogram/
Nuclear weapons can be made to have pretty much as much of a bang as one wants to make them, but with increased explosive yield comes an increased weapon weight. We always talk vaguely about being able to make H-bombs to arbitrarily high yields, but recently I’ve been mulling over this fact somewhat quantitatively. I gave a talk last month at the History of Science Society Meeting on US interest in 50-100 MT bombs around the time of the Limited Test Ban Treaty, and while working on this paper I got slightly obsessed with what is known as the yield-to-weight ratio.
Little Boy — a big bang compared to a conventional bomb, but still a very crude nuclear bomb.
What makes nuclear weapons impressive and terrible is that their default yield-to-weight ratio — that is, the amount of bang per mass, usually expressed in terms of kilotons per kilogram (kt/kg) — is much, much higher than conventional explosives. Take TNT for example. A ton of TNT weighs, well, a ton. By definition. So that’s 0.001 kilotons per 1,000 kilograms; or 0.000001 kt/kg. By comparison, even a crude weapon like the Little Boy bomb that was dropped on Hiroshima was about 15 kilotons in a 4,400 kg package: 0.003 kt/kg. That means that the Little Boy bomb had an energy density three orders of magnitude higher than a regular TNT bomb would. Now, TNT isn’t the be-all and end-all of conventional explosives, but no conventional explosive gets that much boom for its buck compared to a nuke.
The Little Boy yield is much lower than the hypothetical energy density of uranium-235. For every kilogram of uranium-235 that completely fissions, it releases about 17 kt/kg. That means that less than a kilogram of uranium-235 fissioned in the Little Boy bomb to release its 15 kilotons of energy. Knowing that there was 64 kg of uranium in the bomb, that means that something like 1.3% of the uranium in the weapon actually underwent fission. So right off the bat, one could intuit that this is something that could probably be improved upon.
Fat Man — a lot better use of fissile material than Little Boy, but no more efficient in terms of yield-to-weight.
The Fat Man bomb had a much better use of fissile material than Little Boy. Its yield wasn’t that much better (around 20 kilotons), but it managed to squeeze that (literally) out of only 6.2 kilograms of plutonium-239. Pu-239 releases around 19 kilotons per kilogram that completely fissions, so that means that around 15% of the Fat Man core (a little under 1 kg of plutonium) underwent fission. But the bomb itself still weighed 4,700 kg, making its yield-to-weight ratio a mere 0.004 kt/kg. Why, despite the improve efficiency and more advanced design of Fat Man, was the yield ratio almost identical to Little Boy? Because in order to get that 1 kg of fissioning, it required a very heavy apparatus. The explosive lenses weighed something like 2,400 kilograms just by themselves. The depleted uranium tamper that held the core together and reflected neutrons added another 120 kilograms. The aluminum sphere that held the whole apparatus together weighed 520 kilograms. The ballistic case (a necessary thing for any actual weapon!) weighed another 1,400 kg or so. All of these things were necessary to make the bomb either work, or be a droppable bomb.
So it’s unsurprising to learn that improving yield-to-weight ratios was a high order of business in the postwar nuclear program. Thermonuclear fusion ups the ante quite a bit. Lithium-deuteride (LiD), the most common and usable fusion fuel, yields 50 kilotons for every kilogram that undergoes fusion — so fusion is nearly 3 times more energetic per weight than fission. So the more fusion you add to a weapon, the better the yield-to-weight ratio, excepting for the fact that all fusion weapons require a fission primary and usually also have very heavy tampers.
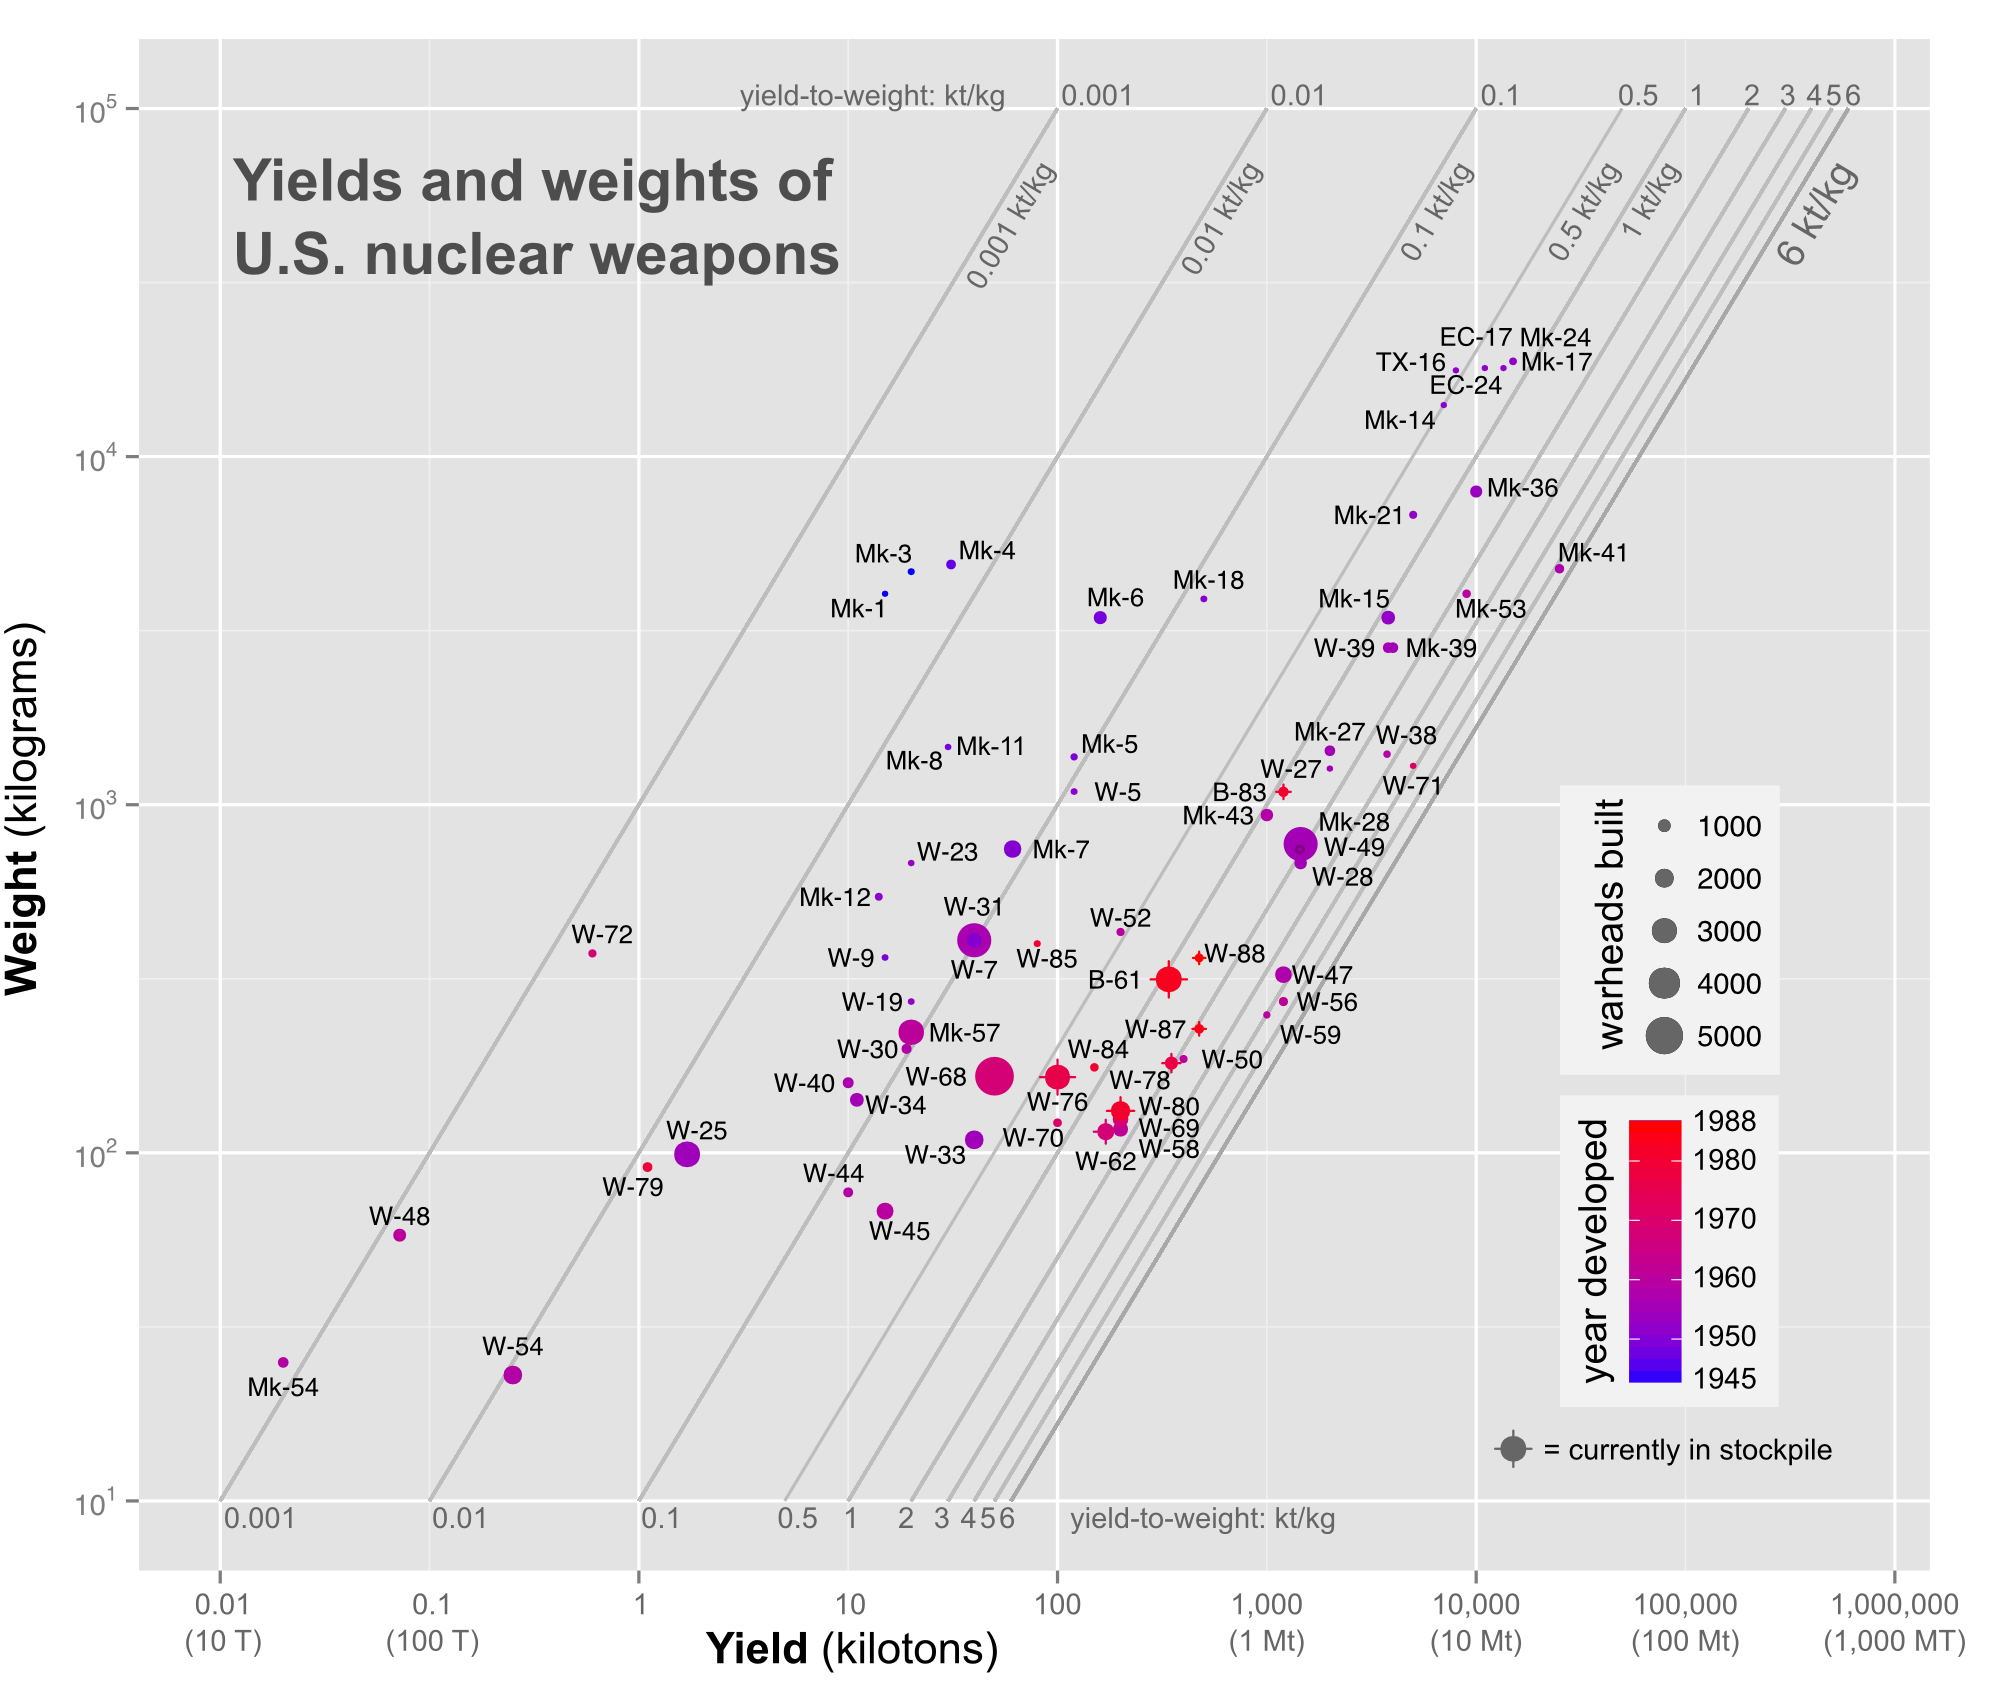
I took all of the reported American nuclear weapon weights and yields from Carey Sublette’s always-useful website, put them into the statistical analysis program R, and created this semi-crazy-looking graph of American yield-to-weight ratios:
The horizontal (x) axis is the yield in kilotons (on a logarithmic scale), the vertical (y) axis is the weight in kilograms (also on a log scale). In choosing which of the weights and yields to use, I’ve always picked the lowest listed weights and the highest listed yields — because I’m interested in the optimal state of the art. The individual scatter points represent models of weapons. The size of each point represents how many of them were produced; the color of them represents when they were first deployed. Those with crosses over them are still in the stockpile. The diagonal lines indicate specific yield-to-weight ratio regions.
A few points of interest here. You can see Little Boy (Mk-1), Fat Man (Mk-3), and the postwar Fat Man improvements (Mk-4 — same weight, bigger yield) at the upper left, between 0.01 kt/kg and 0.001 kt/kg. This is a nice benchmark for fairly inefficient fission weapons. At upper right, you can see the cluster of the first H-bomb designs (TX-16, EC-17, Mk-17, EC-24, Mk-24) — high yield (hence far to the right), but very heavy (hence very high). Again, a good benchmark for first generation high-yield thermonuclear weapons.
What a chart like this lets you do, then, is start to think in a really visual and somewhat quantitative way about the sophistication of late nuclear weapon designs. You can see quite readily, for example, that radical reductions in weight, like the sort required to make small tactical nuclear weapons, generally results in a real decrease in efficiency. Those are the weapons in the lower left corner, pretty much the only weapons in the Little Boy/Fat Man efficiency range (or worse). One can also see that there are a few general trends in design development over time if one looks at how the colors trend.
First there is a movement down and to the right (less weight, more yield — improved fission bombs); there is also a movement sharply up and to the right (high weight, very high yield — thermonuclear weapons) which then moves down and to the left again (high yield, lower weight — improved thermonuclear weapons). There is also the splinter of low-weight, low-yield tactical weapons as well that jots off to the lower left. In the middle-right is what appears to be a sophisticated “sweet spot,” the place where all US weapons currently in the stockpile end up, in the 0.1-3 kt/kg range, especially the 2-3 kt/kg range:
These are the bombs like the W-76 or the B-61 — bombs with “medium” yield warheads (100s rather than 1,000s of kilotons) in relatively low weight packages (100s rather than 1000s of kilograms). These are the weapons take advantage of the fact that they are expected to be relatively accurate (and thus don’t need to be in the multi-megaton range to have strategic implications), along with what are apparently sophisticated thermonuclear design tricks (like spherical secondaries) to squeeze a lot of energy out of what is a relatively small amount of material. Take the W-76 for example: its manages to get 100 kilotons of yield out of 164 kilograms. If we assume that it is a 50/50 fission to fusion ratio, that means that it manages to fully fission about 5 kilograms of fissionable material, and to fully fuse about 2 kilograms of fusionable material. And it takes just 157 kg of other apparatus (and unfissioned or unfused material) to produce that result — which is just a little more than Shaquille O’Neal weighs.
Such weapons aren’t the most efficient. Weapon designer Theodore Taylor wrote in 1987 that 6 kiloton/kilogram had been pretty much the upper limit of what had even been achieved.1 Only a handful of weapons got close to that. The most efficient weapon in the US stockpile was the Mk-41, a ridiculously high yield weapon (25 megatons) that made up for its weight with a lot of fusion energy.
The components of the B-61 nuclear weapon — the warhead is the bullet-shape in the mid-left. The B-61 was designed for flexibility, not miniaturization, but it’s still impressive that it could get 20X the Hiroshima bomb’s output out of that garbage-can sized warhead.
But given that high efficiency is tied to high yields — and relatively high weights — it’s clear that the innovations that allowed for the placing of warheads on MIRVed, submarine-launched platforms are still pretty impressive. The really magical range seems to be for weapons that in the hundred kiloton range (more than 100 kilotons but under a megaton), yet under 1,000 kilograms. Every one of those dates from after 1962, and probably involves the real breakthroughs in warhead design that were first used with the Operation Dominic test series (1962). This is the kind of strategic miniaturization that makes war planners happy.
What’s the payoff of thinking about these kinds of numbers? One is that it allows you to see where innovations have been made, even if you know nothing about how the weapon works. In other words, yield-to-weight ratios can provide a heuristic for making sense of nuclear design sophistication, comparing developments over time without caring about the guts of the weapon itself. It also allows you to make cross-national comparisons in the same fashion. The French nuclear arsenal apparently developed weapons in that same miniaturized yield-to-weight range of the United States by the 1970s — apparently with some help from the United States — and so we can probably assume that they know whatever the United States figured out about miniaturized H-bomb design in the 1960s.
The Tsar Bomba: a whole lot of boom, but a whole lot of weight. The US thought they could make the same amount of boom for half the weight.
Or, to take another tack, and returning to the initial impetus for me looking at this topic, we know that the famous “Tsar Bomba” of the Soviet Union weighed 27,000 kilograms and had a maximum yield of 100 Mt, giving it a yield-to-weight ratio of “only” 3.43 kilotons/kilograms. That’s pretty high, but not for a weapon that used so much fusion energy. It was clear to the Atomic Energy Commission that the Soviets had just scaled up a traditional H-bomb design and had not developed any new tricks. By contrast, the US was confident in 1961 that they could make a 100 Mt weapon that weighed around 13,600 kg (30,000 lb) — an impressive 7.35 kiloton/kilogram ratio, something well above the 6 kt/kg achieved maximum. By 1962, after the Dominic series, they thought they might be able to pull off 50 Mt in only a 4,500 kg (10,000 lb) package — a kind of ridiculous 11 kt/kg ratio. (In this estimate, they noted that the weapon might have an impractically large diameter as a result, perhaps because the secondary was spherical as opposed to cylindrical.) So we can see, without really knowing much about the US had in mind, that it was planning something very, very different from what the Soviets set off.
It’s this black box approach that I find so interesting about these ratios. It’s a crude tool, to be sure, but a tool nonetheless. By looking at the broad trends, we get insights into the specifics, and peel back the veil just a tiny bit.
Complete List of All U.S. Nuclear Weapons
by Carey Sublette
http://nuclearweaponarchive.org/Usa/Weapons/Allbombs.html